These numbers represent the people and communities that benefit from our affordable housing expertise as well as those that continue to need our help.
Facts & Figures
[stat_counter icon_size=”32″ counter_value=”34000+” counter_decimal=”” speed=”3″ desc_font_color=”#ffffff”]
EDUCATION / COUNSELING CUSTOMERS
[stat_counter icon_size=”32″ counter_value=”24M+” counter_sep=”” counter_decimal=”” speed=”4″ desc_font_color=”#ffffff”]
HOMEBUYER LOANS
[stat_counter icon_size=”32″ counter_value=”367M+” counter_sep=”” counter_decimal=”” counter_prefix=”$” speed=”5″ desc_font_color=”#ffffff”]
REAL ESTATE INVESTMENTS
[stat_counter icon_size=”32″ counter_value=”2550+” counter_decimal=”” speed=”5″ desc_font_color=”#ffffff”]
RENTAL HOMES BUILT
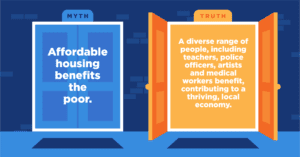
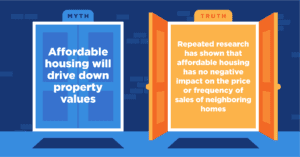
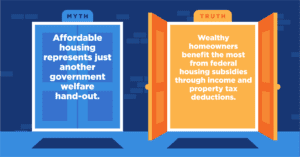
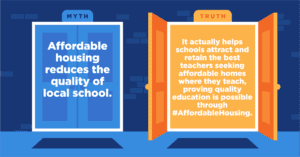
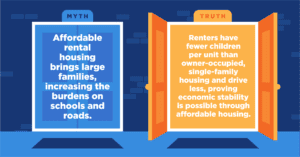
Some Myths & Truths of Affordable Housing